Tables and Plots
table
plot
package
1 Setup
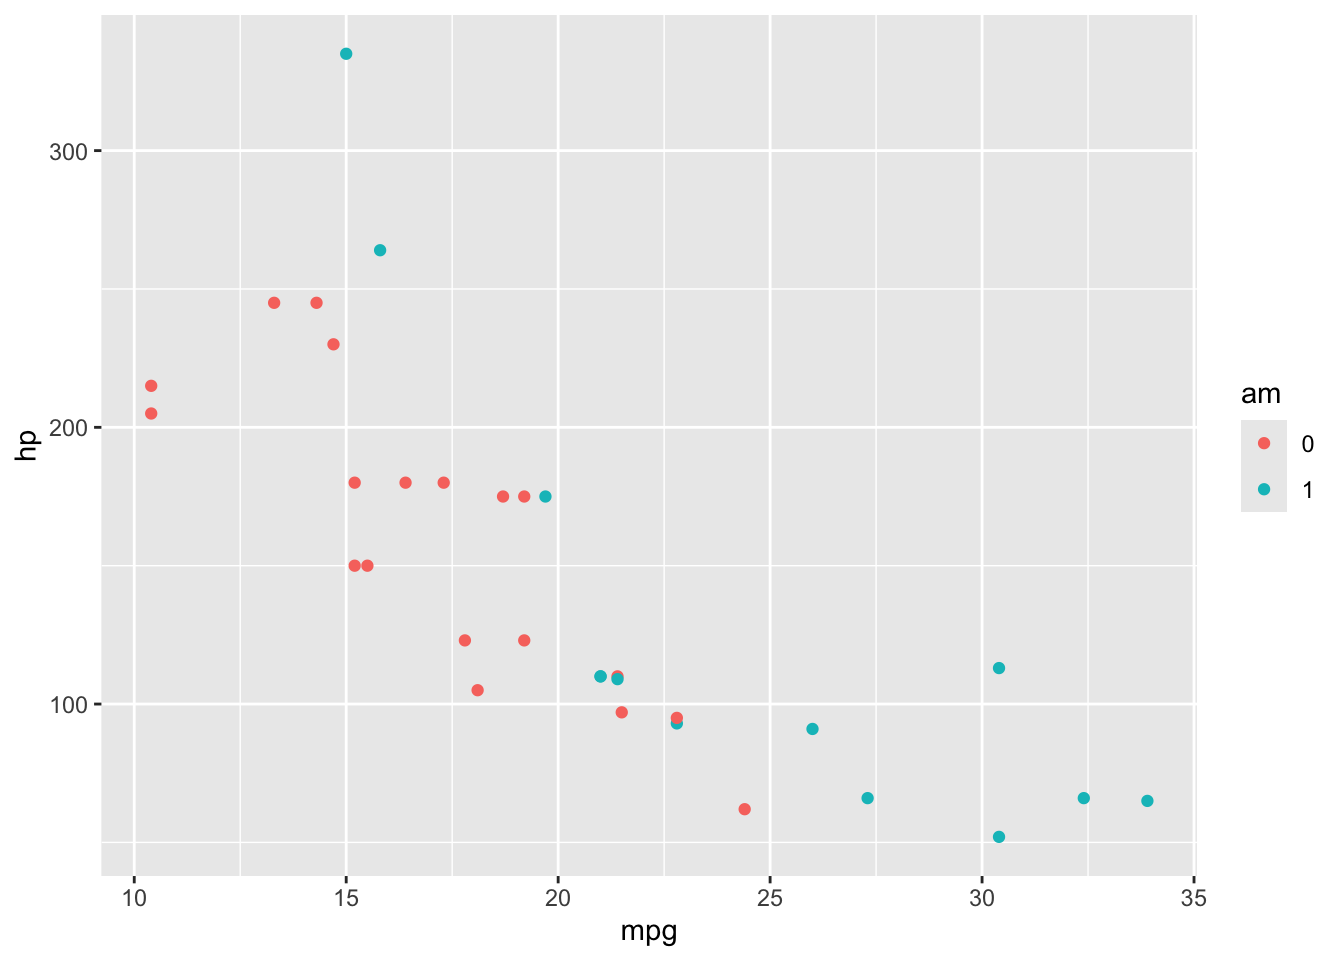
2 Plot
3 Table
| mpg | cyl | disp | hp | drat | wt | qsec | vs | am | gear | carb | |
|---|---|---|---|---|---|---|---|---|---|---|---|
| Mazda RX4 | 21.0 | 6 | 160 | 110 | 3.90 | 2.620 | 16.46 | 0 | 1 | 4 | 4 |
| Mazda RX4 Wag | 21.0 | 6 | 160 | 110 | 3.90 | 2.875 | 17.02 | 0 | 1 | 4 | 4 |
| Datsun 710 | 22.8 | 4 | 108 | 93 | 3.85 | 2.320 | 18.61 | 1 | 1 | 4 | 1 |
| Hornet 4 Drive | 21.4 | 6 | 258 | 110 | 3.08 | 3.215 | 19.44 | 1 | 0 | 3 | 1 |
| Hornet Sportabout | 18.7 | 8 | 360 | 175 | 3.15 | 3.440 | 17.02 | 0 | 0 | 3 | 2 |
3.1 Tables with gtsummary
Characteristic |
N = 84 1 |
|---|---|
| Type | |
| Quebec | 42 (50%) |
| Mississippi | 42 (50%) |
| Treatment | |
| nonchilled | 42 (50%) |
| chilled | 42 (50%) |
| uptake | 28 (18, 37) |
|
1
n (%); Median (Q1, Q3) |
|
Characteristic |
Quebec |
Mississippi |
|---|---|---|
| Treatment | ||
| nonchilled | 21 (50%) | 21 (50%) |
| chilled | 21 (50%) | 21 (50%) |
| uptake | 37 (30, 40) | 19 (14, 28) |
|
1
n (%); Median (Q1, Q3) |
||
The following errors were returned during `add_p()`:
✖ For variable `Treatment` (`Type`) and "p.value" statistic: The package
  "cardx" (>= 0.2.0) is required.
✖ For variable `uptake` (`Type`) and "p.value" statistic: The package "cardx"
  (>= 0.2.0) is required.
Characteristic |
Quebec |
Mississippi |
p-value |
|---|---|---|---|
| Treatment | |||
| nonchilled | 21 (50%) | 21 (50%) | |
| chilled | 21 (50%) | 21 (50%) | |
| uptake | 37 (30, 40) | 19 (14, 28) | |
|
1
n (%); Median (Q1, Q3) |
|||