Animations plot with gganimate
animations
package
1 Setup
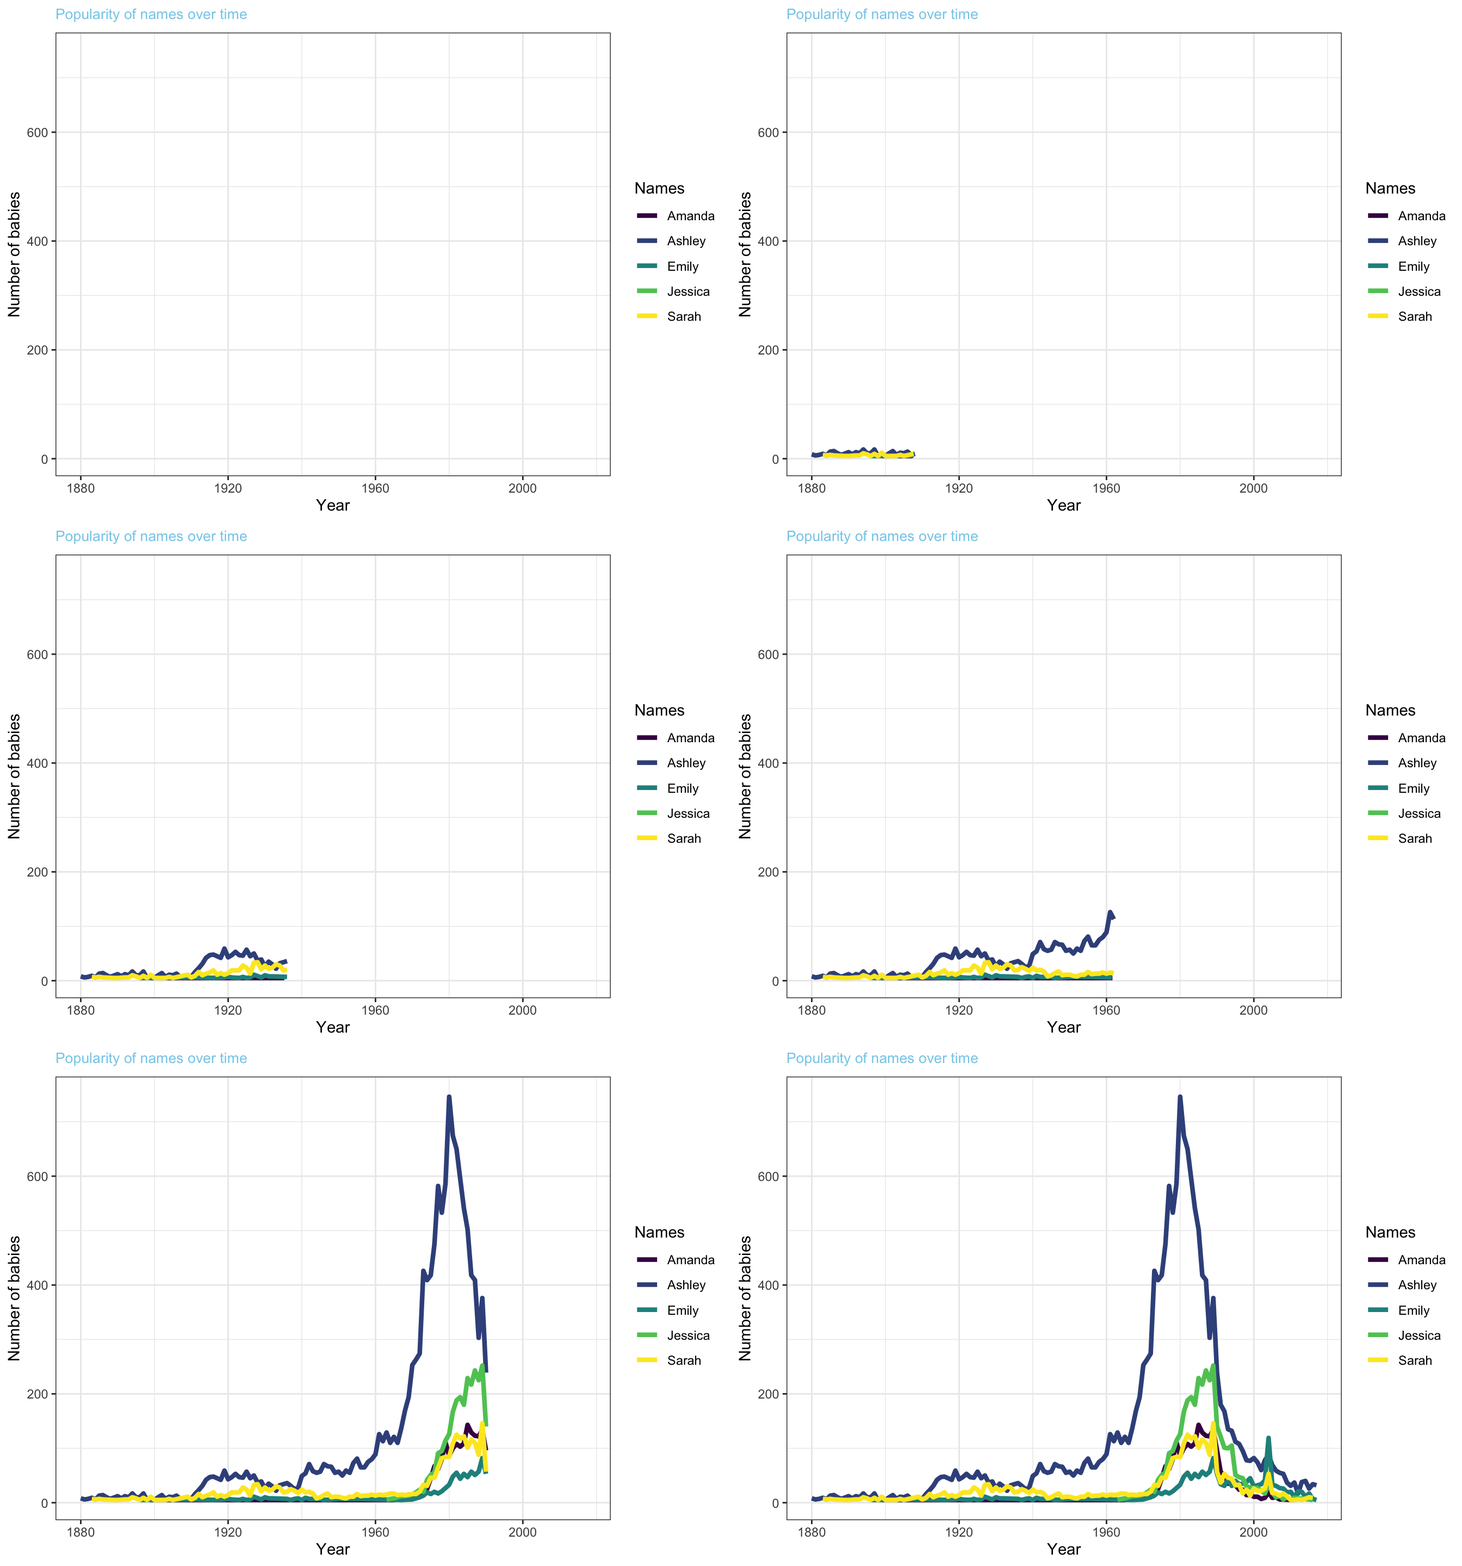
2 Baby names
Code
babynames |>
  filter(name %in% c("Ashley", "Amanda", "Jessica", "Sarah", "Emily"),
         sex == "M") |>
  ggplot(aes(x = year, y = n, color = name, group = name)) +
  geom_line(linewidth = 1.5) +
  theme_bw() +
  scale_color_viridis(discrete = TRUE) +
  labs(title = "Popularity of names over time",
       x = "Year",
       y = "Number of babies",
       color = "Names") +
  theme(plot.title = element_text(size = 10,
                                  colour = "skyblue")) +
  transition_reveal(year)
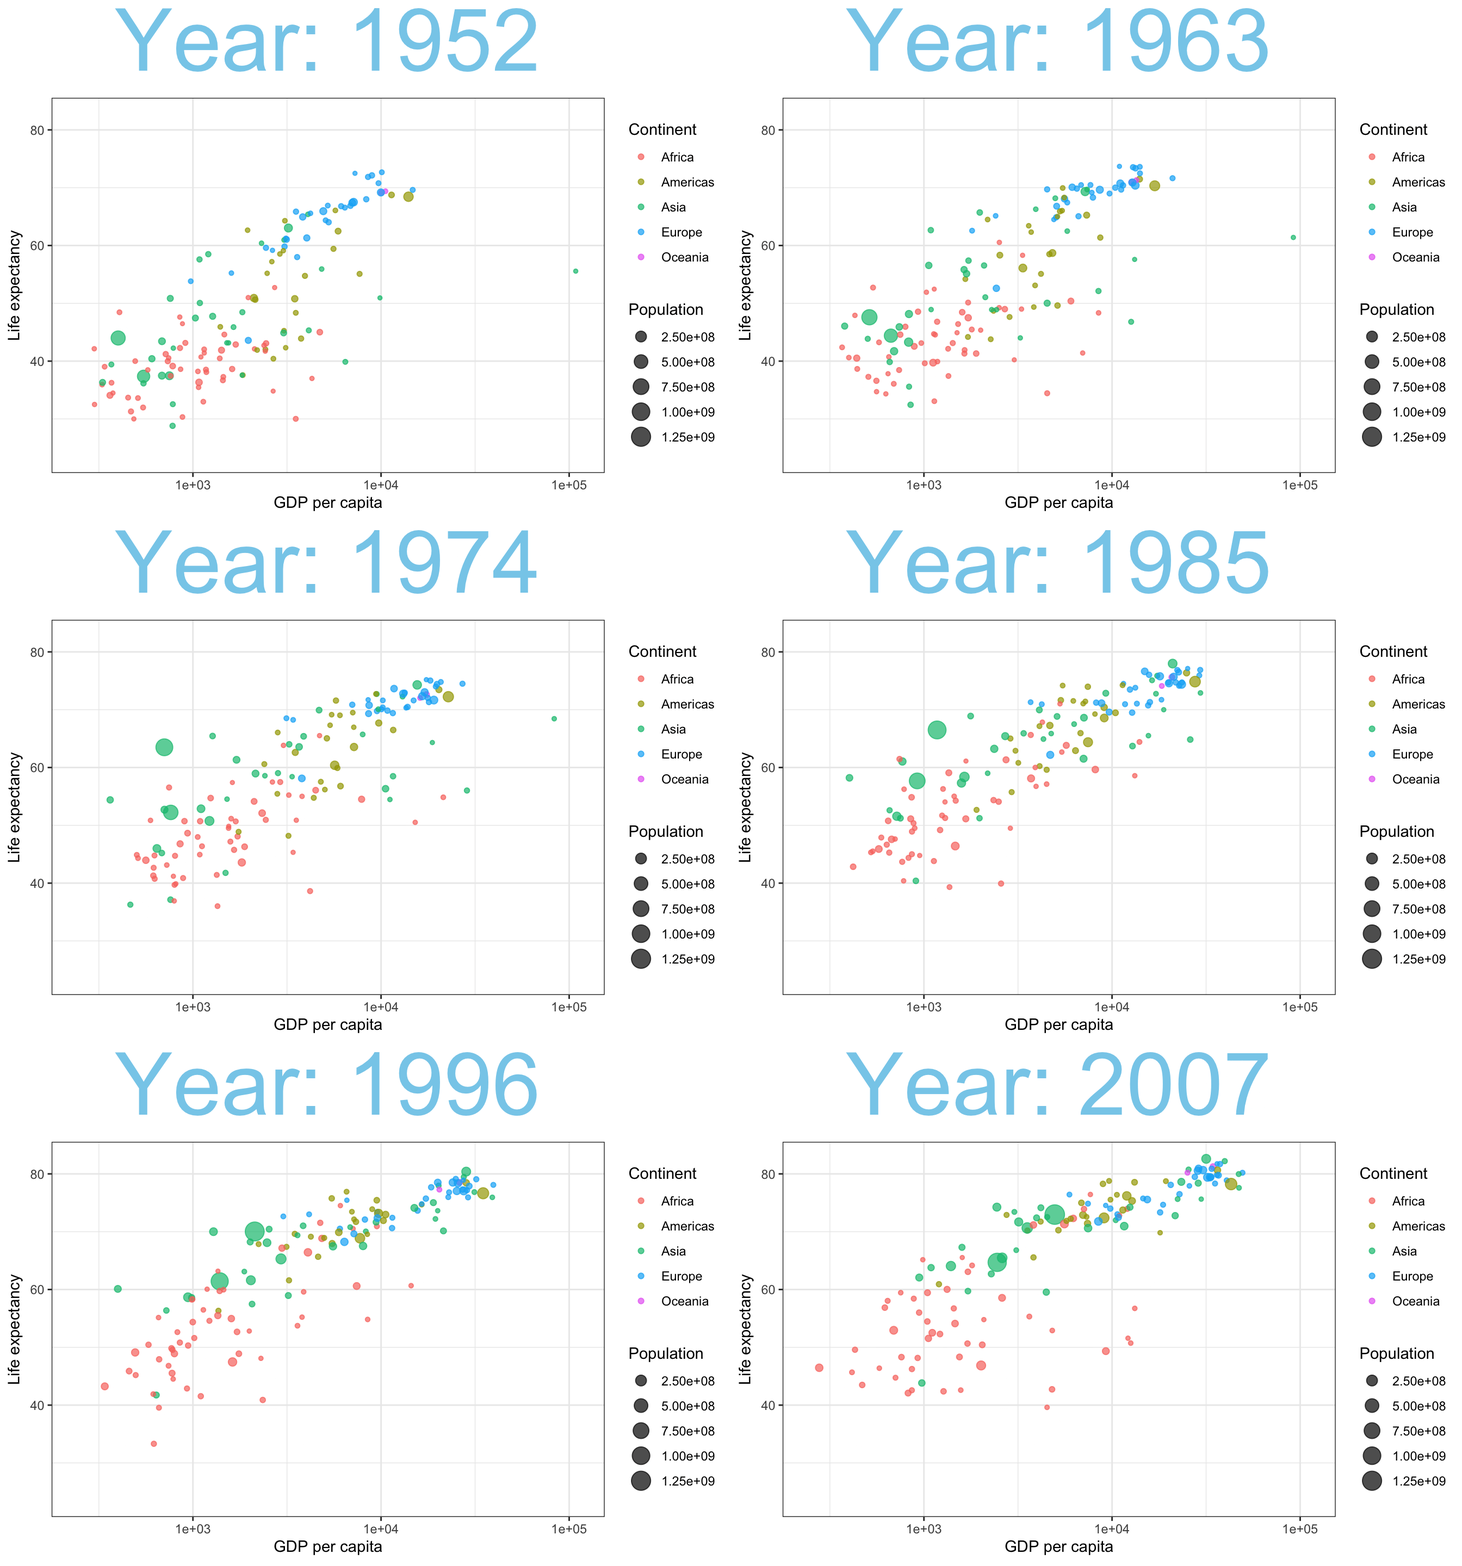
3 Life expectancy: scatter plot
Code
gapminder |>
  ggplot(aes(x = gdpPercap, y = lifeExp, size = pop, color = continent)) +
  geom_point(alpha = 0.7) +
  scale_x_log10() +
  theme_bw() +
  labs(title = "Year: {frame_time}",
       x = "GDP per capita",
       y = "Life expectancy",
       size = "Population",
       color = "Continent") +
  theme(plot.title = element_text(size = 60,
                                  hjust = 0.5,
                                  colour = "skyblue")) +
  transition_time(year)
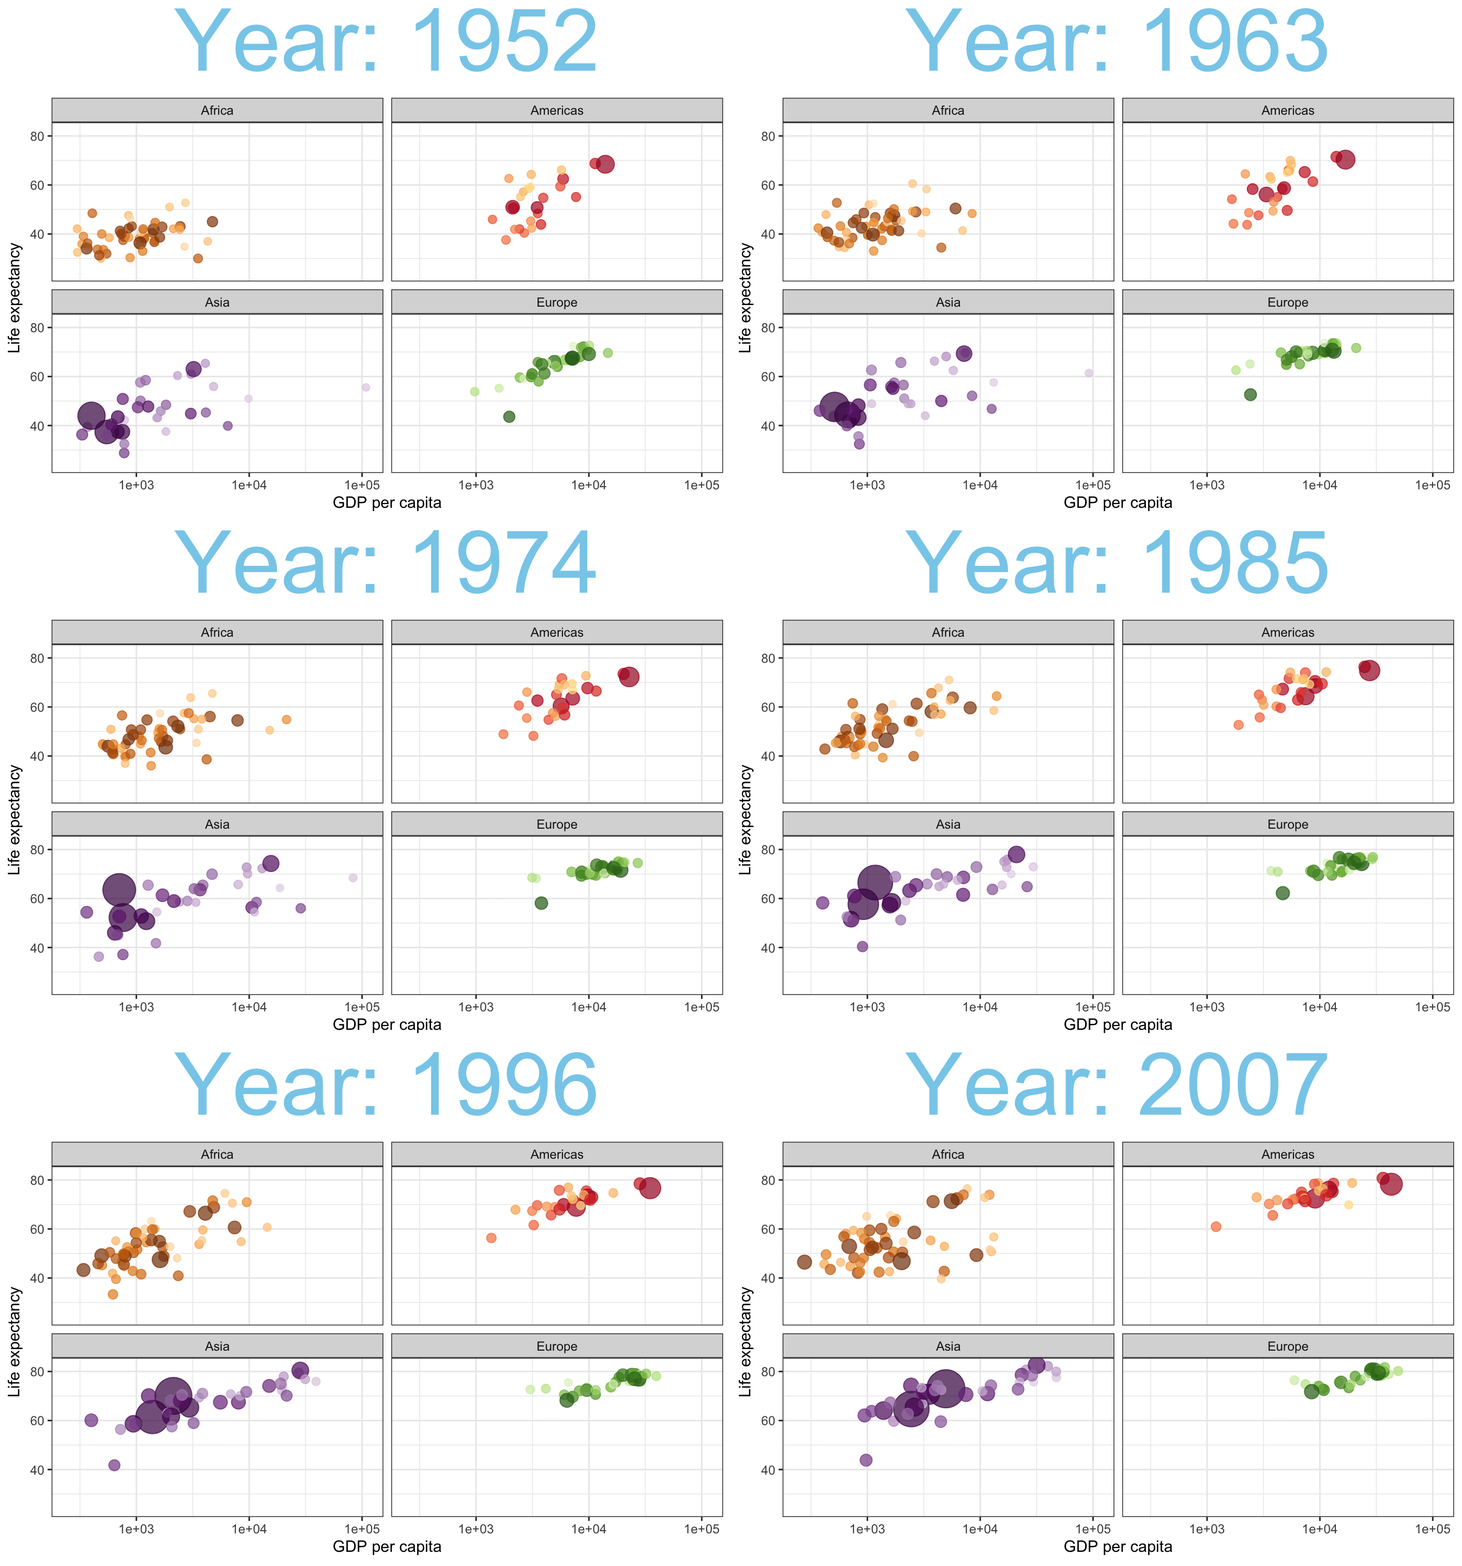
4 Life expectancy: scatter plot with facet
Code
gapminder |>
  filter(continent != "Oceania") |>
  ggplot(aes(x = gdpPercap, y = lifeExp, size = pop, color = country)) +
  geom_point(alpha = 0.7,
             show.legend = F) +
  scale_color_manual(values = country_colors) +
  scale_size(range = c(2, 12)) +
  scale_x_log10() +
  facet_wrap(~continent) +
  theme_bw() +
  labs(title = "Year: {frame_time}",
       x = "GDP per capita",
       y = "Life expectancy",
       size = "Population",
       color = "Continent") +
  theme(plot.title = element_text(size = 60,
                                  hjust = 0.5,
                                  colour = "skyblue")) +
  transition_time(year)
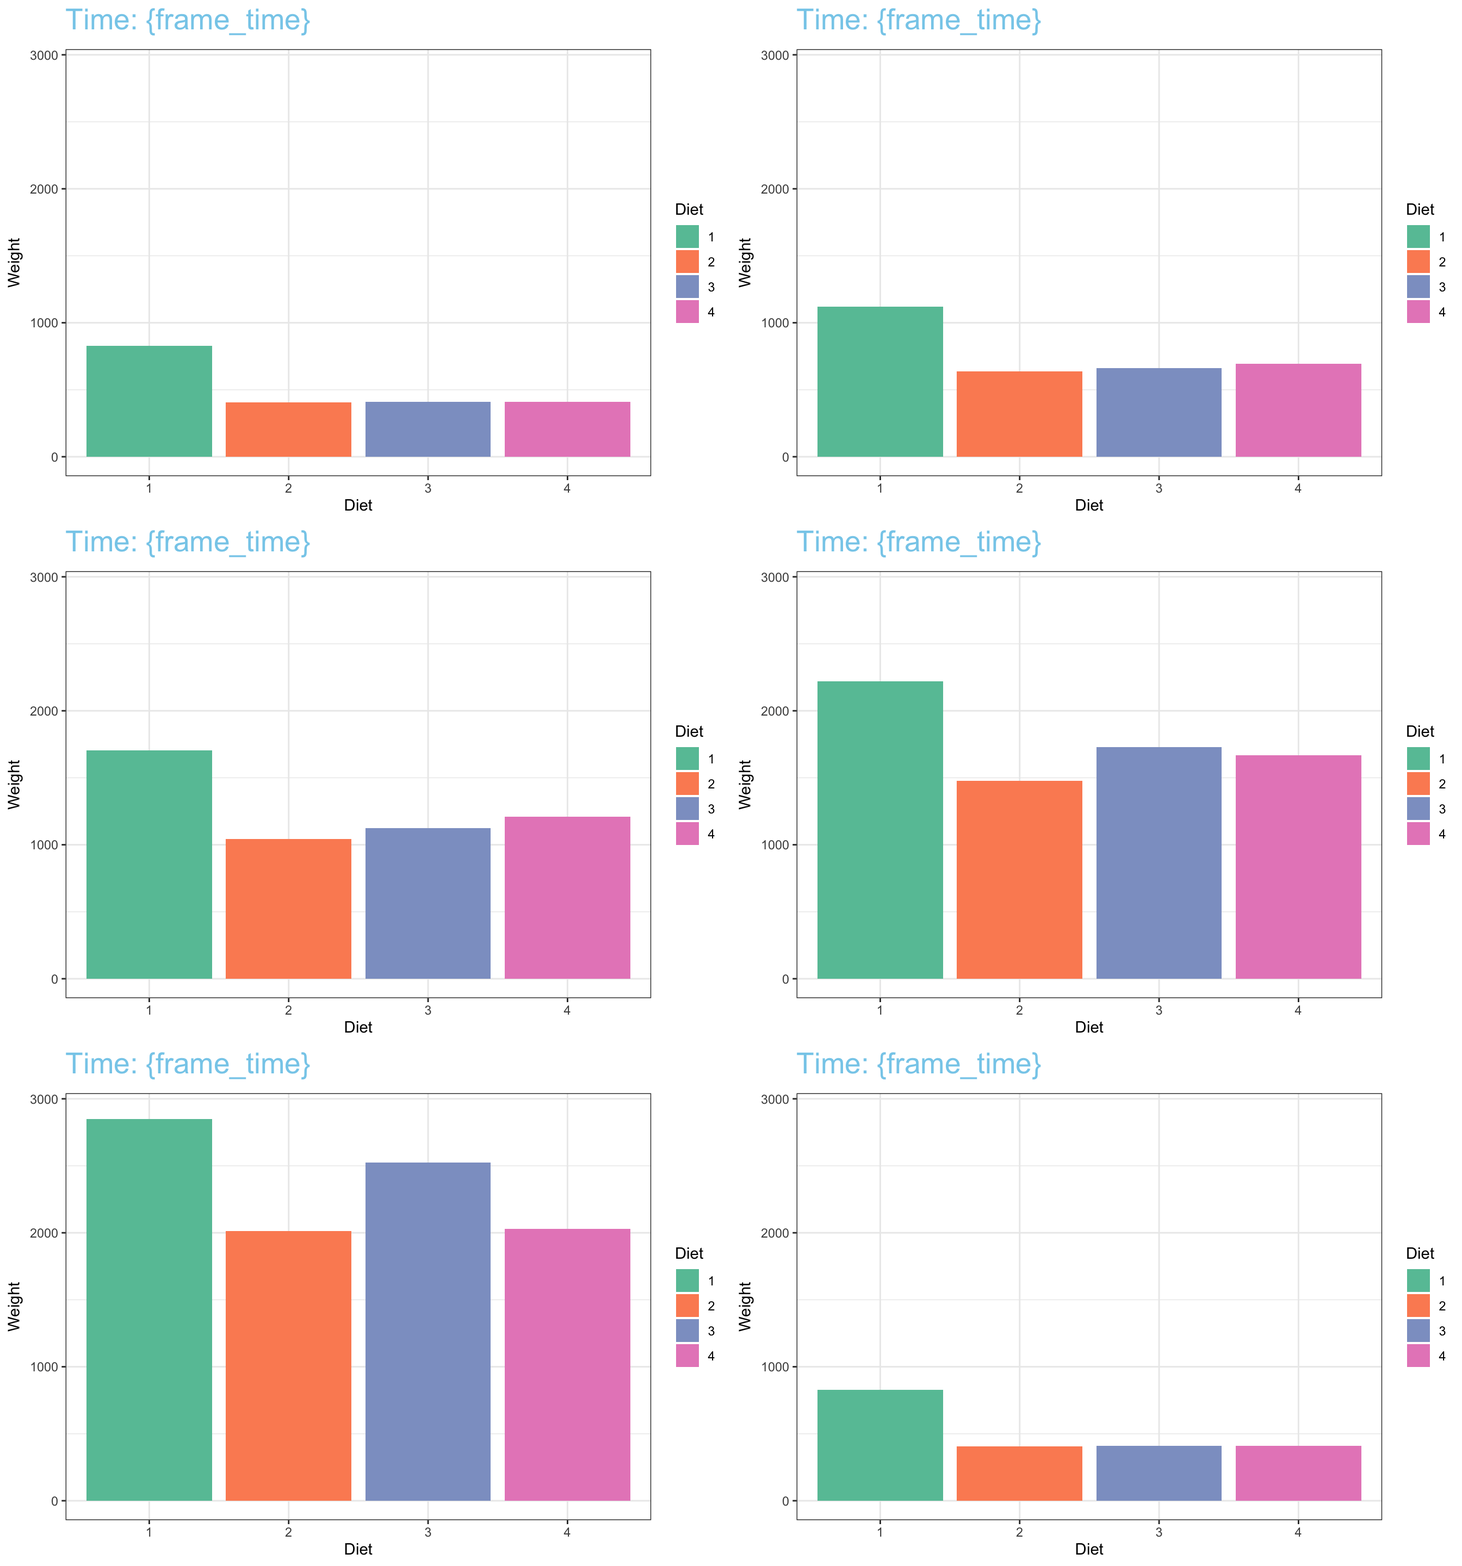
5 Life expectancy: Barplot
Code
ChickWeight |>
   ggplot(aes(x = factor(Diet), y = weight, fill = Diet)) +
  geom_bar(stat = "identity") +
  theme_bw() +
  scale_fill_brewer(palette = "Set2") +
  labs(title = "Time: {frame_time}",
       x = "Diet",
       y = "Weight") +
  theme(plot.title = element_text(size = 20,
                                  #hjust = 0.5,
                                  colour = "skyblue")) +
  transition_states(Time)


